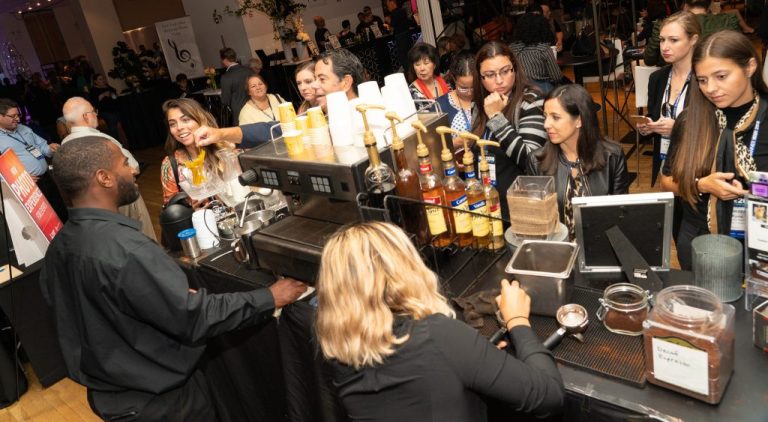
Not only is coffee the most popular drink, it’s also a cultural phenomenon here in the United States. With coffee catering rising in popularity and whipped coffee becoming a TikTok craze, there’s no shortage of coffee love. From ages young to old, coffee drinkers run rampant in the US. But aside from just drinking coffee, there are a few other points of research to get into.
Since coffee is one of the world’s most studied drinks, it’s time we dive into a few coffee infographics that may (or may not) surprise you.

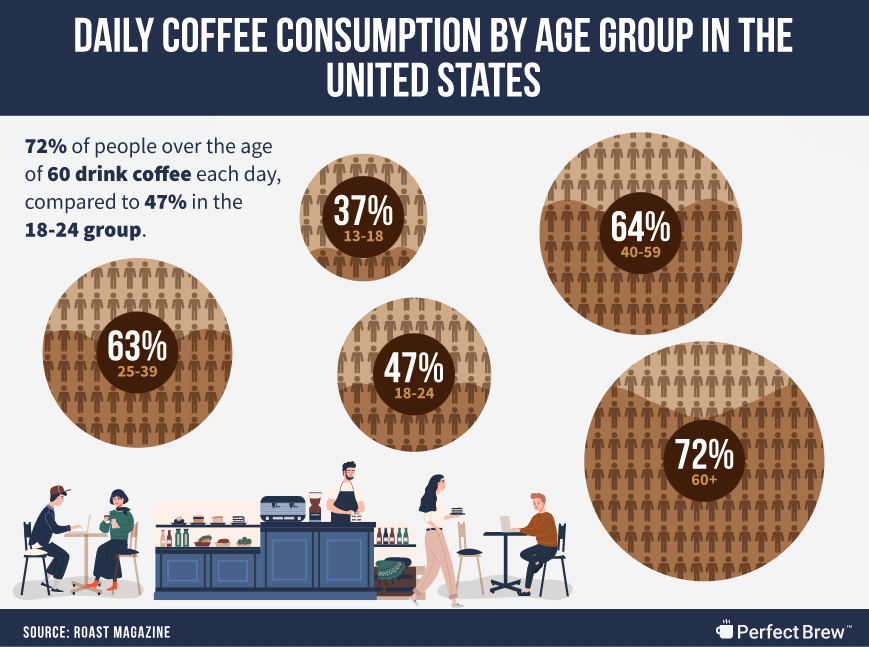
Daily Coffee Consumption by Age Group in the United States
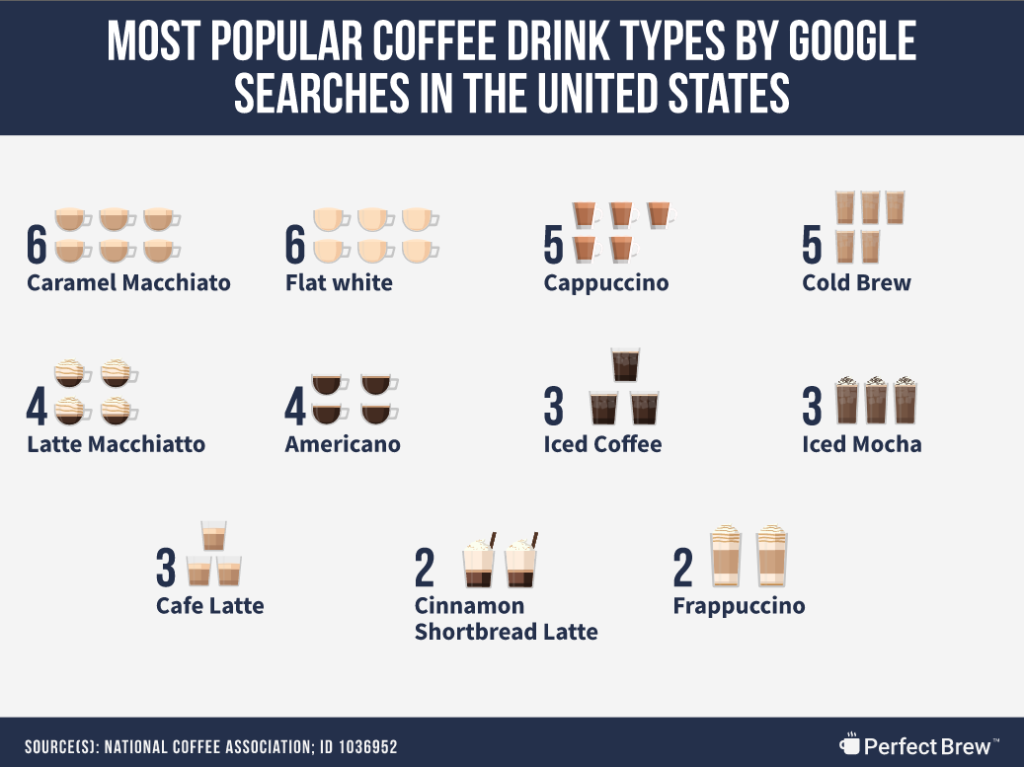
Most Popular Coffee Drink Types by Google Searches in the United States
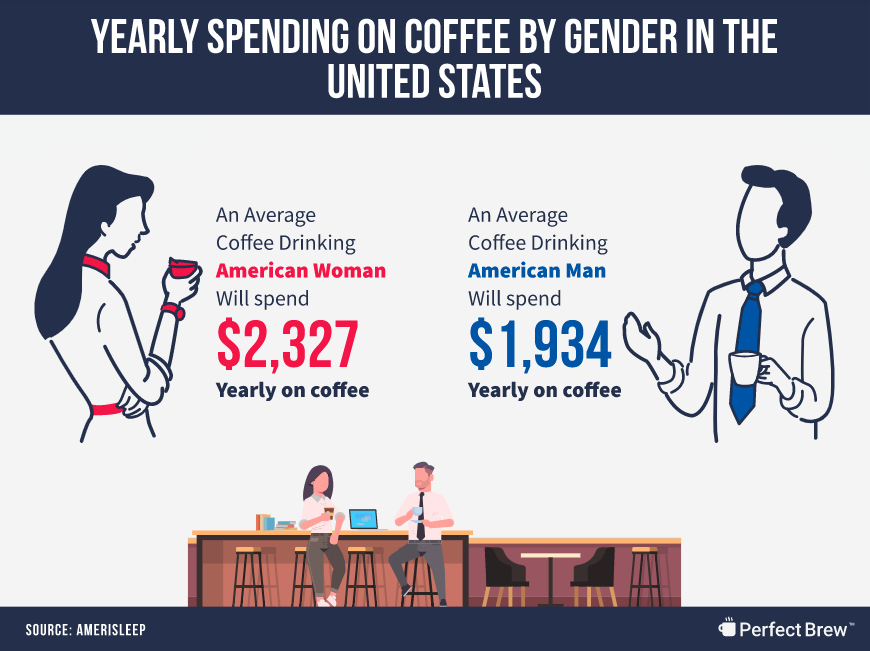
Coffee Consumption per Capita by Gender in the United States
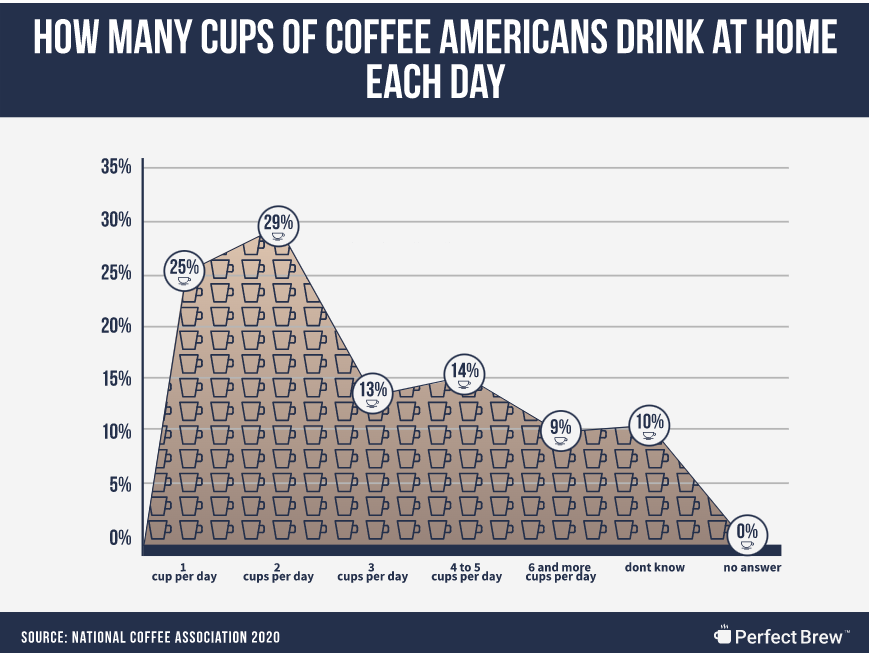
How Many Cups of Coffee do Americans Drink at Home Each Day
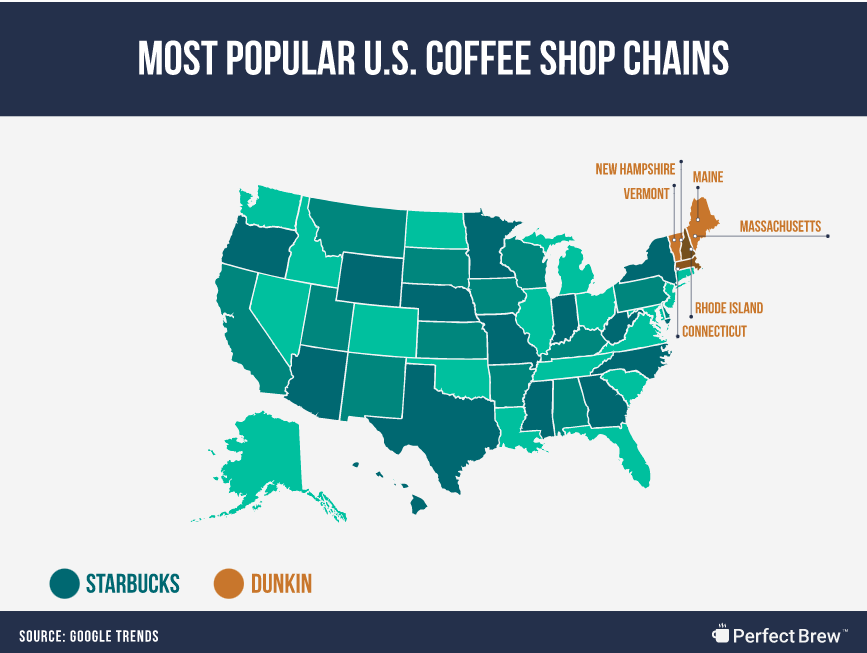
Most Popular U.S. Coffee Shop Chains
Thank you to perfectbrew.com for pulling together these statistics/coffee infographics!
